The Platform
Less Time Gathering Data. More Time Generating Alpha.
A complete AI research platform built for investment professionals. Generate institutional-grade research reports, monitor your investment theses around the clock, analyze 10 years of financial data, and collaborate with your team — all in one place.
12,000+
Words per research report
14
Data sources per report
10
Languages for reports
24/7
Automated thesis monitoring
How Investment Teams Work
Built Around Your Workflow
Not organized by features — organized by how you actually work. From sourcing data to presenting to your investment committee.
Source & Discover
All your data in one place. Earnings transcripts, SEC filings, news, press releases, analyst estimates, and 10 years of financial statements — automatically aggregated and ready for analysis.
Analyze & Research
Generate 12,000+ word institutional-grade research reports with a single click. AI synthesizes 14 data sources into comprehensive investment analysis with valuation models and bull/base/bear scenarios.
Monitor & Track
Thesis-driven surveillance with AI-generated signposts. Define your bull and bear cases, and let our monitors scan news, earnings, filings, and cross-company signals 24/7.
Collaborate & Report
Share research with your team in real-time, export reports to PDF, and preserve institutional knowledge. Everything stays organized by project.
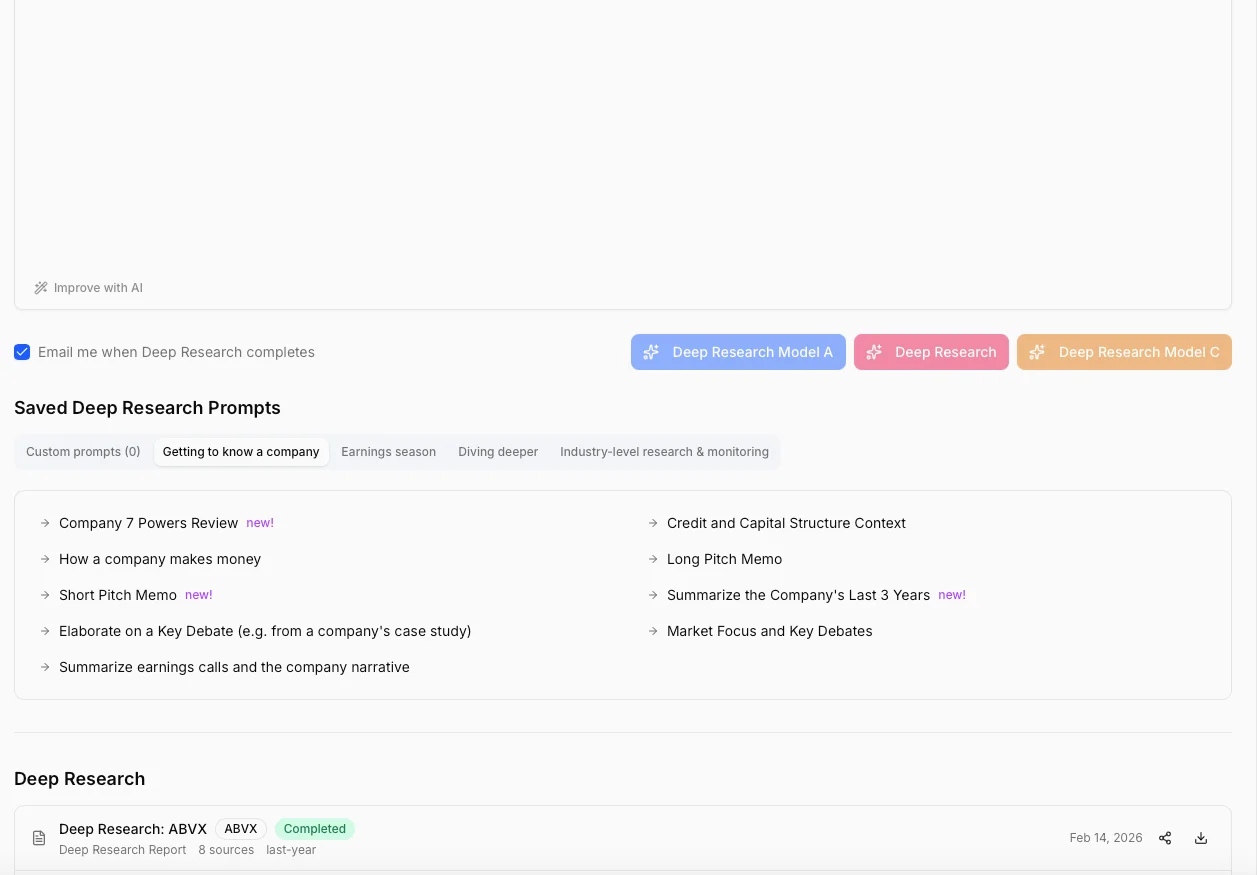
Deep Research
Institutional-Grade Research in Minutes, Not Days
Our AI doesn't just summarize — it synthesizes. Deep Research reports analyze up to 14 data source types simultaneously — from 10 years of income statements to the latest earnings call transcript — and produce 8,000 to 12,000 word reports with the structure and depth of a sell-side initiation.
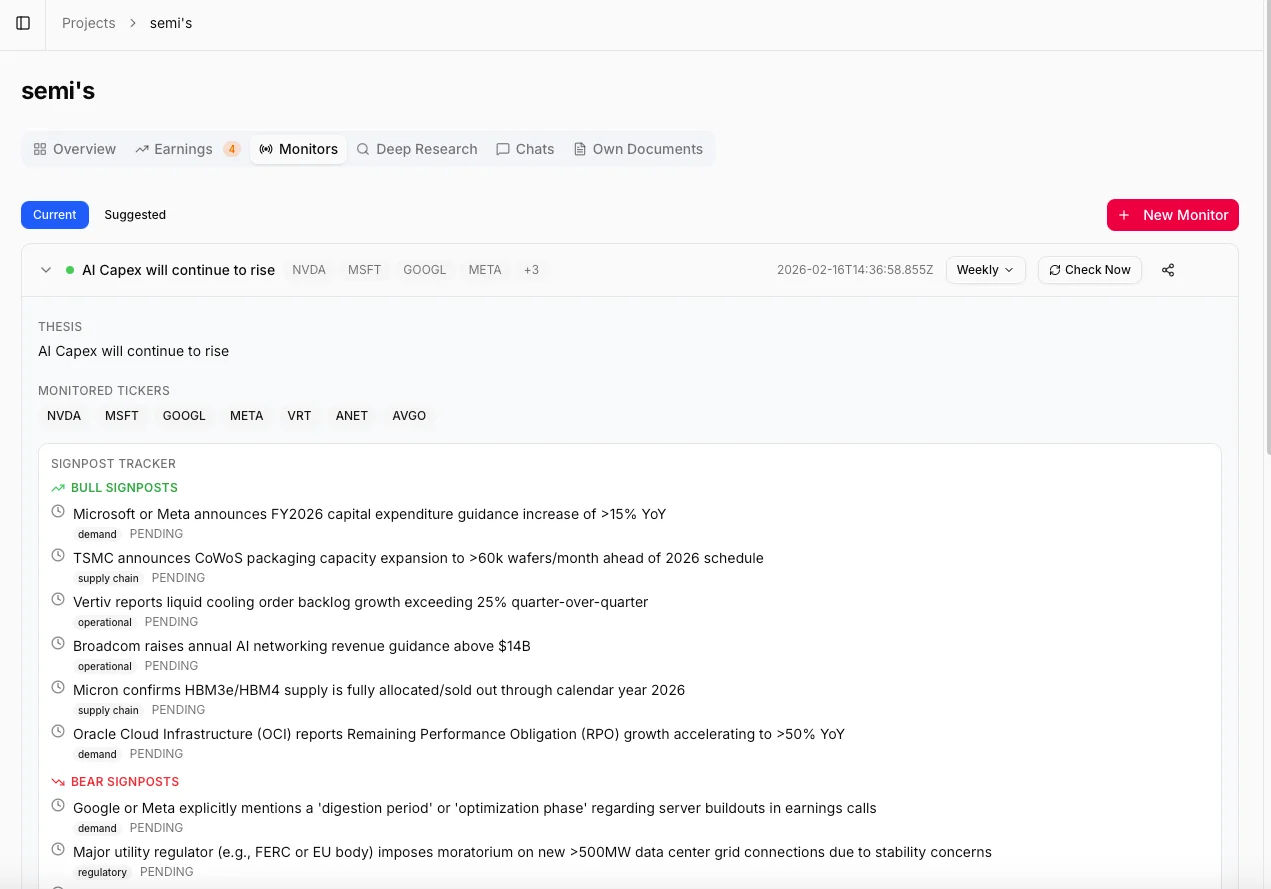
Investment Monitors
Thesis-Driven Monitoring That Works While You Sleep
Describe your investment thesis in plain language. Our AI builds a complete monitoring framework: it suggests relevant tickers, identifies related companies across the supply chain, and generates 8–12 bull and bear signposts. Then it monitors everything — daily, weekly, or monthly — and tells you what changed and why it matters.
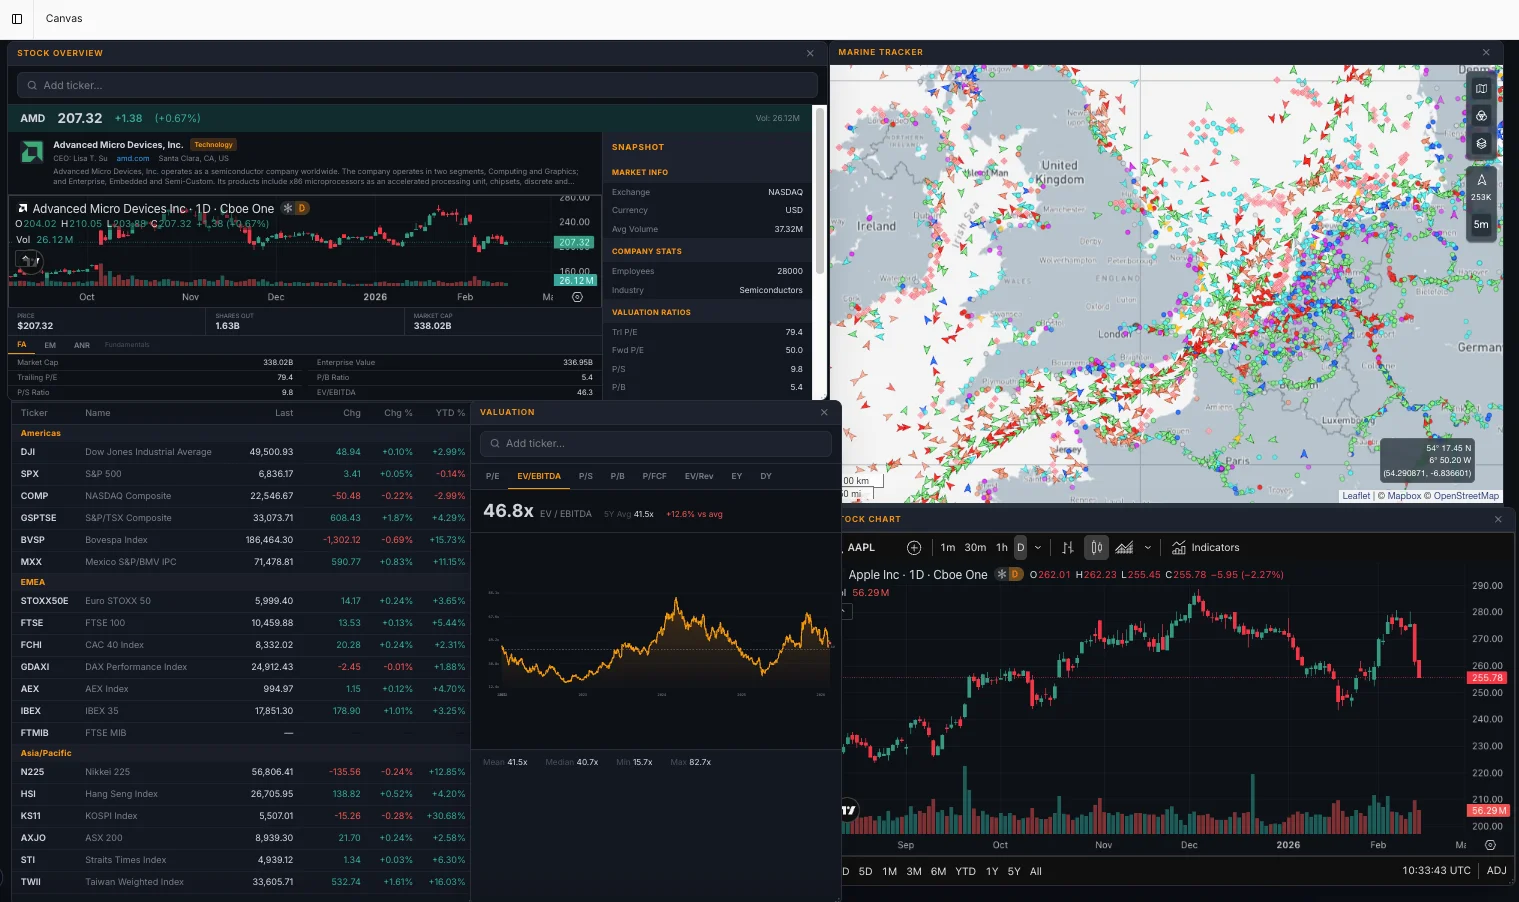
Interactive Canvas
Your Bloomberg-Like Research Dashboard
A fully customizable, multi-window workspace inspired by professional trading terminals. Drag, drop, and resize widgets to build the perfect research dashboard. Track 19 global indices, view TradingView charts with full technical analysis, monitor your watchlists, and analyze financial ratios — all in one view.
AI Research Chat
Ask Questions. Get Answers Backed by Real Data.
Chat with your financial data like you'd talk to a senior analyst. Select specific companies and data sources, ask complex investment questions, and get detailed answers drawn directly from earnings calls, SEC filings, financial statements, and market data. Every answer links back to the original source.
More Capabilities
Everything Else You Need
Company Intelligence
10 Years of Financial Data at Your Fingertips
Every company in your project gets a dedicated intelligence page with 10 years of financial statements, interactive charts, earnings history, key ratios, and a live news feed. Click any metric to instantly generate a visual chart with CAGR calculations.
Document Intelligence
Your Documents, Supercharged by AI
Upload your own proprietary documents — internal memos, financial models, competitor analyses, board presentations — and let AI incorporate them into your research. Combine private data with public financial data for a complete picture.
Earnings Tracking
Never Miss an Earnings Date Again
Automatic earnings calendar for every company in your projects. See upcoming dates, actual vs. estimated EPS and revenue, historical surprise data, and full earnings call transcripts — all in one view.
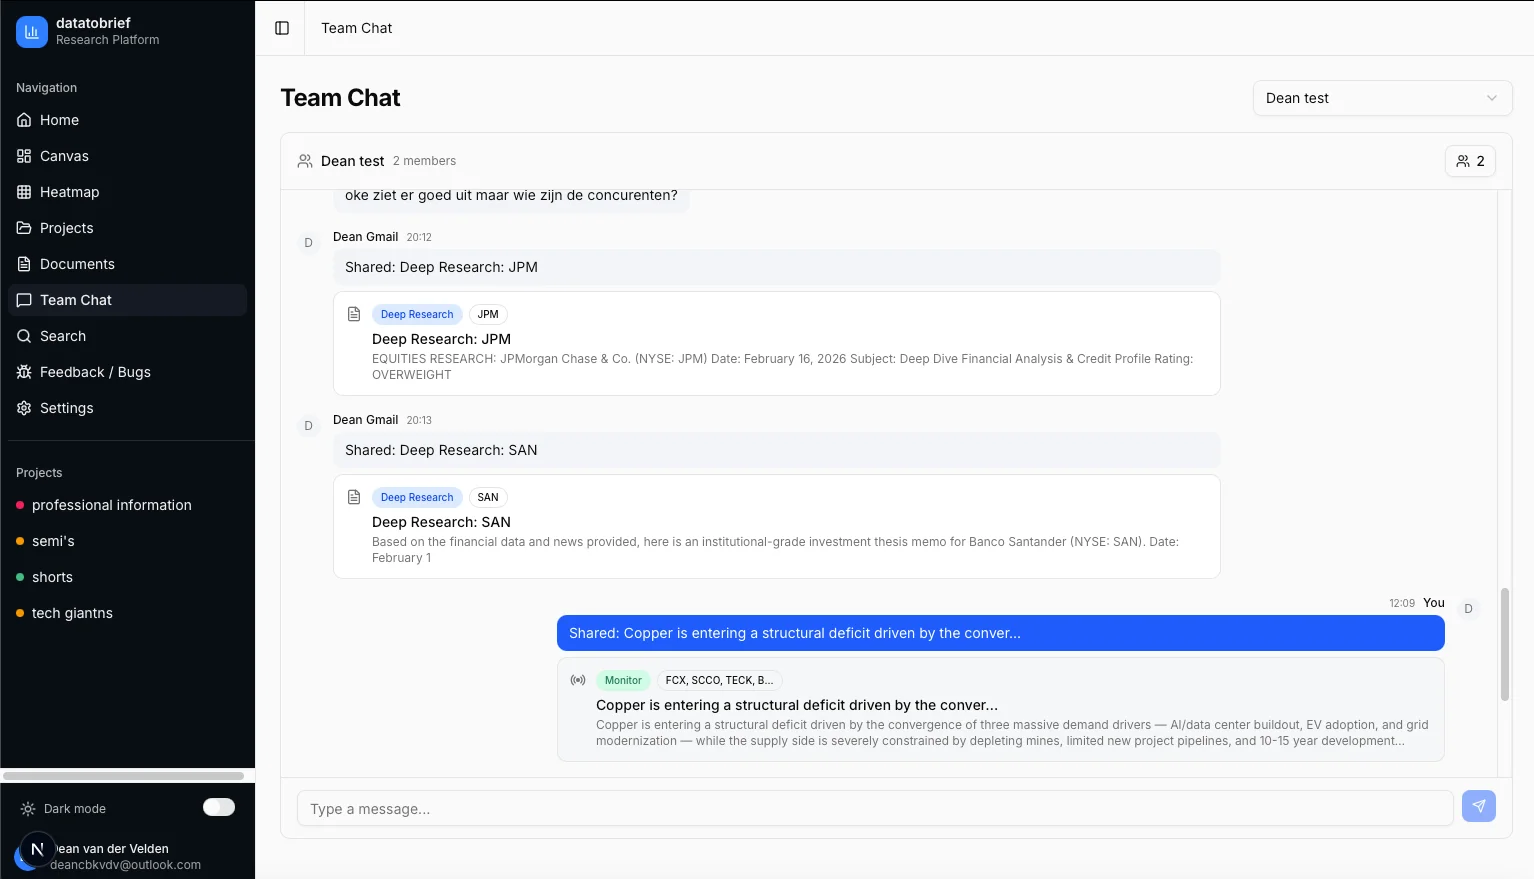
Team Collaboration
Built for Investment Teams, Not Solo Analysts
Invite your team to shared projects, collaborate in real-time, and preserve institutional knowledge. Every piece of research, every monitor update, every document is shareable with one click.
Data & Integrations
All the Financial Data You Need, Automatically Aggregated
Comprehensive data from trusted sources — integrated into every report, monitor, and chat. No manual data gathering required.
Income Statements
Up to 10 years annual + 40 quarters
Balance Sheets
Complete assets, liabilities & equity
Cash Flow Statements
Operating, investing & financing flows
SEC Filings
10-K, 10-Q, 8-K — full text access
Earnings Transcripts
Full call transcripts with Q&A sections
Analyst Estimates
Consensus EPS & revenue estimates
Key Metrics & Ratios
200+ ratios: P/E, ROE, D/E, and more
News & Press Releases
Real-time company-specific news feeds
Price Targets
Analyst price targets & consensus
Stock Prices
Historical OHLCV data, all timeframes
Company Profiles
Sector, industry, CEO, employee count
Global Indices
19 indices across 3 regions, real-time
Enterprise-Grade Security
Your data is protected with row-level security, encrypted storage, and European data practices. Complete data isolation between organizations. Per-user budget controls and usage monitoring. Built for the compliance requirements of European investment firms.
Learn more about our security →Ready to transform your research workflow?
Join select investment teams already using DataToBrief.
We respect your privacy. No spam.